Benchmarks like statistics can be incredibly misleading in ways that are only obvious with detailed analysis. Recently the apache HTTPCore project released some benchmark results whose headline results read as:
Jetty
HttpCore
Linux BIO
35,342
56,185
Linux NIO
1,873
25,970
Windows BIO
31,641
29,438
Windows NIO
6,045
13,076
So is HttpCore really an faster than Jetty and does Jetty NIO suck? For this particular benchmark, the answer is obviously YES and YES. But the qualification “for this particular benchmark” is very important, since this benchmark is setup to places a huge penalty on the kind of latency that jetty uses to dispatch requests. Normally latency can be traded off for throughput, but with this benchmark, adding 2ms of latency to a request is the difference between 56,000 requests/sec and 8000 requests/sec. Jetty makes frequent latency vs throughput tradeoffs, is thus is severly penalized by this benchmark.
[Note that I’m not saying the HttpCore team have done anything wrong and the “Lie, Damned Lies” head line is only a joking reference to the Mark Twain quote about the power of numbers to show almost anything. Our own benchmarks are biases towards our own sweet spots. This blog seeks only to explain the reasons for the results and not to criticize the HttpCore team].
HTTP
Server Throughput Limits
Typically the throughput of a server is going to be limited by the minimum of one of the following factors:
Network Bandwidth Limitations
The total network capacity may limit the maximum throughput. If each response is 10KB in size and the network is only capable of 10MB/s, then 1024 requests per second will saturate that benchmark. The HttpCore benchmark used 2048B messages of the localhost network, which essentially has no maximum throughput. So for the modelling of this benchmark, I have assumed a GB network, which would have a potential maximum through put of 524288 requests/sec, if it is not limited by other factors.
CPU Limitations
The number of request that can be processed may be limited by the available CPU power. If each request took 2ms of CPU time to process, then each CPU could only handle 500 requests per second. For the HttpCore benchmark, they had a 4 CPU box and they have very simple/efficient request handling that took less than 0.018ms per request, which results in potential maximum throughput of 4*1000/0.018 = 222,222 requests/sec, if
it is not limited by other factors.
Connection Limitations
HTTP typically has 1 request outstanding per connection (except when pipelines are used (rarely)), thus the maximal throughput of the server may be limited by the sum of the maximal throughput of each connection. The maximal throughput of a HTTP connection is mostly governed by the round trip time of each request, for example if each request takes 10ms in it’s round trip, then a connection can only handle 100 requests per second. The HttpCore benchmark has requests that take 0.45ms round trip on 25 connections, which results in a potential maximum throughput of 25*1000/0.45ms = 56180 requests/second.
HttpCore Throughput Limitation
It can be seen from the analysis above that the HttpCore benchmark throughput is the limited at 56180 requests/second by the number connections and the round trip time of a request over each connection. More importantly, this limit is numerically sensitive to the specific values chosen for the number of connections and latency. The following chart shows the minimum of the 3 limitations for the HttpCore benchmark against the number of connections and additional request latency (either in network or the server):
CPU’s 4 CPU time per request (ms) 0.018 Network latency (ms) 0.427 Max requests/s by CPU 222222 Request size 2048 Network bandwidth (MB) 1024 Max requests/s by bandwidth 524288

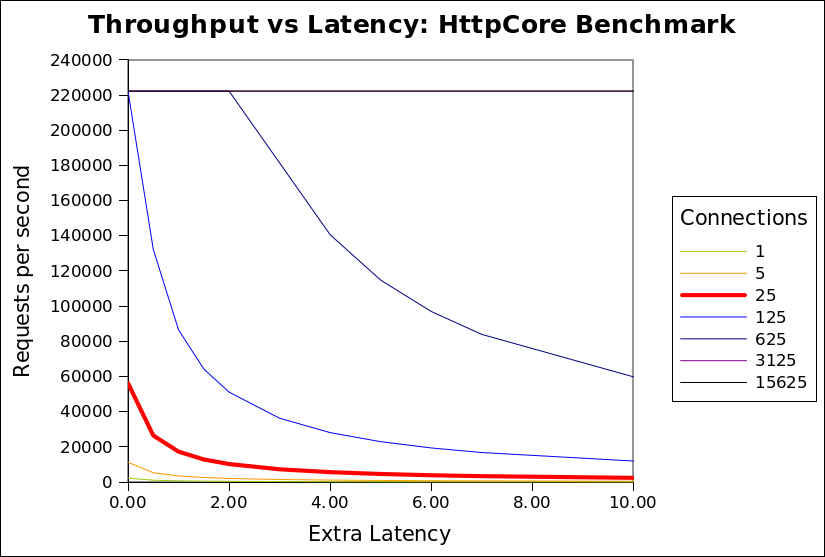
It can be seen that the network bandwidth limitation (524288/s) is never the limiting factor. The CPU limitation (222222/s) is only applicable once the number of connections
exceeds 125. At the 25 connections used by the HttpCore benchmark, it can be seen that any extra latency results in a rapid reduction in throughput from almost 60000/s to less than 2000/s.
The benchmark puts both Jetty and HttpCore on the red (25 connection) curve, but HttpCore is on the absolute left hand side of the curve, while jetty is a few ms of latency to the right. Thus jetty, which uses extra latency (for good reasons described below), is heavily punished by this benchmark, because the benchmark happens to be on one of the steepest sections of that graph (although it looks like it could be worse at 125 connections, but I expect some other limitation would prevent HttpCore reaching 222222/s).
Realistic Throughput limitations
The configuration of the HttpCore benchmark do not well match the reality faced by most HTTP servers for which throughput is a concern. Specifically:
- The localhost network has less than 1ms of round trip latency, when real internet applications must expect at least 10s if not 100s of ms of network latency.
- A modern browser will open 6 connections to the same host, so 25 connections represent only 4 simultaneous users. The expectation for a loaded HTTP server is that it will see at least 100s if not 1000s of simultaneous connections.
- Real connections are mostly idle and will hardly ever see a new request <1ms after a response is sent.
- Java webservers are typically used for dynamic pages that will take more that 0.018ms to generate. If the CPU time per request is increased to 0.15ms per request, then the CPU Limitation is reduced to 26667/s.
The chart below is updated with these more realistic assumptions:
CPU’s 4 CPU time per request (ms) 0.150 Network latency (ms) 20.000 Max requests/s by CPU 26667 Request size 2048 Network bandwidth (MB) 100 Max requests/s by bandwidth 51200

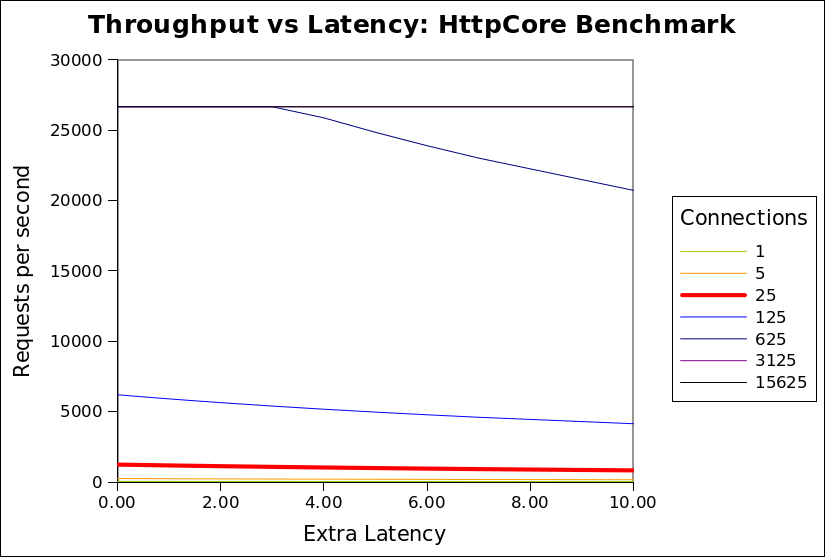
I invite you to download the spreadsheet used to generate these graphs and experiment with the assumptions, so that you can see that in many (if not most) scenarios, that throughput is not significantly sensitive to latency. It is only with the specific assumptions used by HttpCore that latency is a sensitive parameter.
Why use Latency?
I have demonstrated that in realistic scenarios (with many connections and some network latency), then additional latency in handling a request should not have a significant impact on throughput. So why does Jetty have a higher latency per request than HttpCore?
The HttpCore NIO server as configured for the benchmark used a single thread per CPU core, each allocated to a select set terminating a proportion of the connections. Each thread reads a request, writes the response and then loops back to the select set, looking for a the next connection to read the next available request. This is very efficient, but only if all requests can be handled without blocking. If the handling the request blocks for any reason (eg writing response to slow client, waiting for DB, waiting for a synchronize lock, etc) then all the other requests from the same select set will also be blocked and throughput will be greatly reduced. For a 4 CPU machine, it would only take 4 slow clients or 4 long DB queries to block the entire server and prevent any requests from being handled. The HttpCore benchmark avoids this situation by having simple non blocking requests handlers and no slow clients, networks or databases etc.
It is unacceptable in most real HTTP deployments to allow one request to block unrelated requests due to thread starvation. Thus most HTTP servers operate with at thread pool and dispatch the handling of each request to different thread from that handling the NIO select set. Since each request is handled in a dedicated thread, then it may block without affecting other requests or reducing the throughput of the server.
When a request is dispatched to a thread pool, it typically waits for a few ms in a job queue for a thread to be allocated to handle the request. For most realistic scenarios this extra latency has little or no cost and significant benefit, but in the HttpCore benchmark this latency is heavily penalized as it delays the response, thus it delays the load generator sending the next request. Throughput is reduced because the client sends less requests, not because the server cannot handle them.
Also the benchmark compared the raw HTTP components of HttpCore vs the rich servlet environment of Jetty. Jetty will consume some extra CPU/latency to establish the servlet context which provides many benefits of functionality to the application developer. Jetty could also be configured as a simple HTTP handler and would thus use both less CPU and less latency.
Conclusion
The HttpCore benchmark is essentially comparing apples with oranges. The benchmark is setup to mostly measure the raw speed of the HttpCore HTTP parsing/generating capabilities. and does not represent a realistic load test. The Jetty configuration used has been optimized to be a general purpose application server and HTTP server for large numbers of mostly idle connections. Given this disparity, I think it is great that Jetty was
able to able to achieve similar and sometimes better performance in some of the scenarios. This shows that Jetty’s own HTTP parsing/generation is no slouch and that it would be interesting to compare jetty if it was stripped of it’s thread pool and servlet container. If we find the time we may provide such a configuration.
For anybody that really wants to know which server would be faster for them (and the different feature sets do not guide their selection), then they need to setup their own benchmark with a load generator that will produce a traffic profile as close as possible to what their real application will experience.
10 Comments
Eric Rizzo · 19/06/2010 at 16:09
What a great analysis and explanation, Greg. I admire your tone; you kept it analytical and resisted the temptation to make it competitive.
I think it would be good to have a link to this analysis from the benchmark wiki page.
nisse · 27/06/2010 at 03:30
Its just plain silly to enforce the overhead that dispatching is.
You can do a lot of the request processing, reading and parsing in the 1 per cpu selector threads.
Only for the specific cases where you NEED to do blocking logic or long running tasks should you dispatch,
how hard is that to grasp ?.
The thread pools used in 99% of the java app servers tend to be just bad too.
The misconception that you need a min max size and idletimeout on the threads is just hurting when the throughput matters, at high load.
Idle threads is hardly expensive on modern systems.
but people are stuck in old thinking and what is worse , far too many are reacting by fear instead of inspiration to every situation and further preventing truly good designs.
Greg Wilkins · 27/06/2010 at 10:28
Nisse,
it is impossible for a server to know when something might block. Specifically any response written to a request may block. Plus the server code and the application code are frequently written by different organizations, so the server cannot know if the application is going to block or not.
Also note that the jetty thread pools is very efficient and give significantly better performance than the pools available in the JVM.
Finally if you really want to configure jetty to not dispatch, it would be possible to do with little effort.
Anonymous · 30/06/2010 at 07:04
Greg, thanks a lot for the detailed explanation. Still, I wonder how dispatching can have such a huge effect, especially in the case of Linux NIO. You say requests are queued for a few milliseconds before being picked up by a thread. Why is that the case when there are only 25 concurrent requests? Shouldn’t there be a pooled thread available for each request that’s coming in?
Also, i guess the BIO connector also does some kind of dispatching/thread-pooling. Why is it that it’s so fast?
I’m sure you’re right in saying that this benchmark doesn’t reflect any real usage pattern, but unfortunately it’s benchmarks like this that people base real decisions on.
Greg Wilkins · 30/06/2010 at 18:44
Hannes,
It is true that dispatching to a thread pool cannot account for the 10ms latency required to produce the poor linux/NIO result. Jetty will be using more CPU per request since it does more (establish a rich servlet application context, looks for sessions, authentication, etc.), but even that would not explain the full degradation. I expect there might have been some network issue like delayed acks, slow startup or naggle algorithm in play, but I’d have to look at the traces in detail to tell. But the point being that latency that in most cases would not have any perceivable QOS impact, will greatly influence the outcome of this benchmark.
Note also, if you see my next blog on cometd2, you will see that we achieve a far greater request rate with NIO/Linux for the more complex cometd2 requests/response, even with 20,000 connections.
Anonymous · 01/07/2010 at 19:21
So it looks like there’s something in the nonblocking connector (pre-dispatch) code that doesn’t like the < 50 clients benchmark situations to much, especially on Linux. I don't know if you remember, but I chatted with you on IRC about this - increasing the number of acceptors from 2 to 8 fixed the benchmark results for me - 4 or 6 acceptors didn't do the trick, even though I'm using a dual core processor. Might be the same problem with this benchmark.
rd · 11/11/2010 at 23:06
“So for the modelling of this benchmark, I have assumed a GB network, which would have a potential maximum through put of 524288 requests/sec, if it is not limited by other factors.”
By GB network, do you mean Gigabit Ethernet or 10 Gigabit Ethernet?
For Gigabit Ethernet I get a figure of ~60,000 messages/sec. (950Mbps after TCP overhead => 118MBps => 120,000 KBps => the pipe can accept ~60,000 messages of 2KB each every second.)
How did you arrive at your number?
Greg Wilkins · 12/11/2010 at 17:21
RD,
for the HttpCore modelling, I was not using real network numbers. They use localhost for their tests, which as a very very high effective bandwidth, so I just guessed 1024 Mega Bytes per second to ensure that network was not the limiting factor in that model.
For the realistic model, I reduced this to 100MB, which is still a very fast network approx equivalent to the 118MB you calculated for a Gigabit ethernet. Thus I used 51K messages/second while you calculated 60K. In reality, I think most servers are still probably on 100mbs networks, so network limitations will kick in earlier and server latency is even less important.
Truth in Benchmarking! | Webtide Blogs · 29/05/2012 at 12:45
[…] of my pet peeves is misleading benchmarks, as discussed in my Lies, Damned Lies and Benchmarks blog. Recently there has been a bit of interest in Vert.x, some of it resulting from apparently […]
Node.js vs SilkJS « T F D · 28/09/2012 at 09:25
[…] first read why not to trust benchmarks http://webtide.intalio.com/2010/06/lies-damned-lies-and-benchmarks-2/ once you’ve read that lets assume that everyone creating a benchmark is trying to show their […]
Comments are closed.