TL;DR
This is a quick blog to share the performance figures of Jetty 12 and to compare them to Jetty 11, updated for the release of 12.0.2. The outcome of our benchmarks is that Jetty 12 with EE10 Servlet-6.0 is 5% percent faster than Jetty 11 EE9 Servlet-5.0. The Jetty-12 Core API is 22% faster.
These percentages are calculated from the P99 integrals, which is the total latency excluding the 1% slowest requests from each of the 180 sample periods. The max latency for the 1% slowest requests in each sample shows a modest improvement for Jetty-12 servlets and a significant improvement for core.
Introduction
We use one server (powered by a 16 cores Intel Core i9-7960X) connected with a 10GbE link to a dedicated switch, upon which four clients are connected with a single 1GbE link each. The server runs a single instance of the Jetty Server running with the default of 200 threads and a 32 GB heap managed by ZGC, and the clients each run a single instance of the Jetty Load Generator running with an 8 GB heap also managed by ZGC. This is all automated, and the source of this benchmark is public too.
Each client applies a load of 60,000 requests per second for a total of 240,000 requests per second that the server handles alone. We make sure there is no saturation anywhere: CPU consumption, network links, RAM, JVM heap, HTTP response status are monitored to ensure this is the case. We also make sure no errors are reported in HTTP response statuses or on the network interface.
We collect all processing times of the Jetty Server (i.e.: the time it takes from reading the 1st byte of the request from the socket to writing the last byte of the response to the socket) in histograms from which we then graph the minimum, P99, and maximum latencies, and calculate integrals (i.e.: the sum of all measurements) for latter two.
Jetty 12
In the following three benchmarks, the CPU consumption of the server machine stayed around 40%.
Below are plots of the maximum (graph in yellow), minimum to P99 (graph in red) processing times for Jetty 12:
ee10
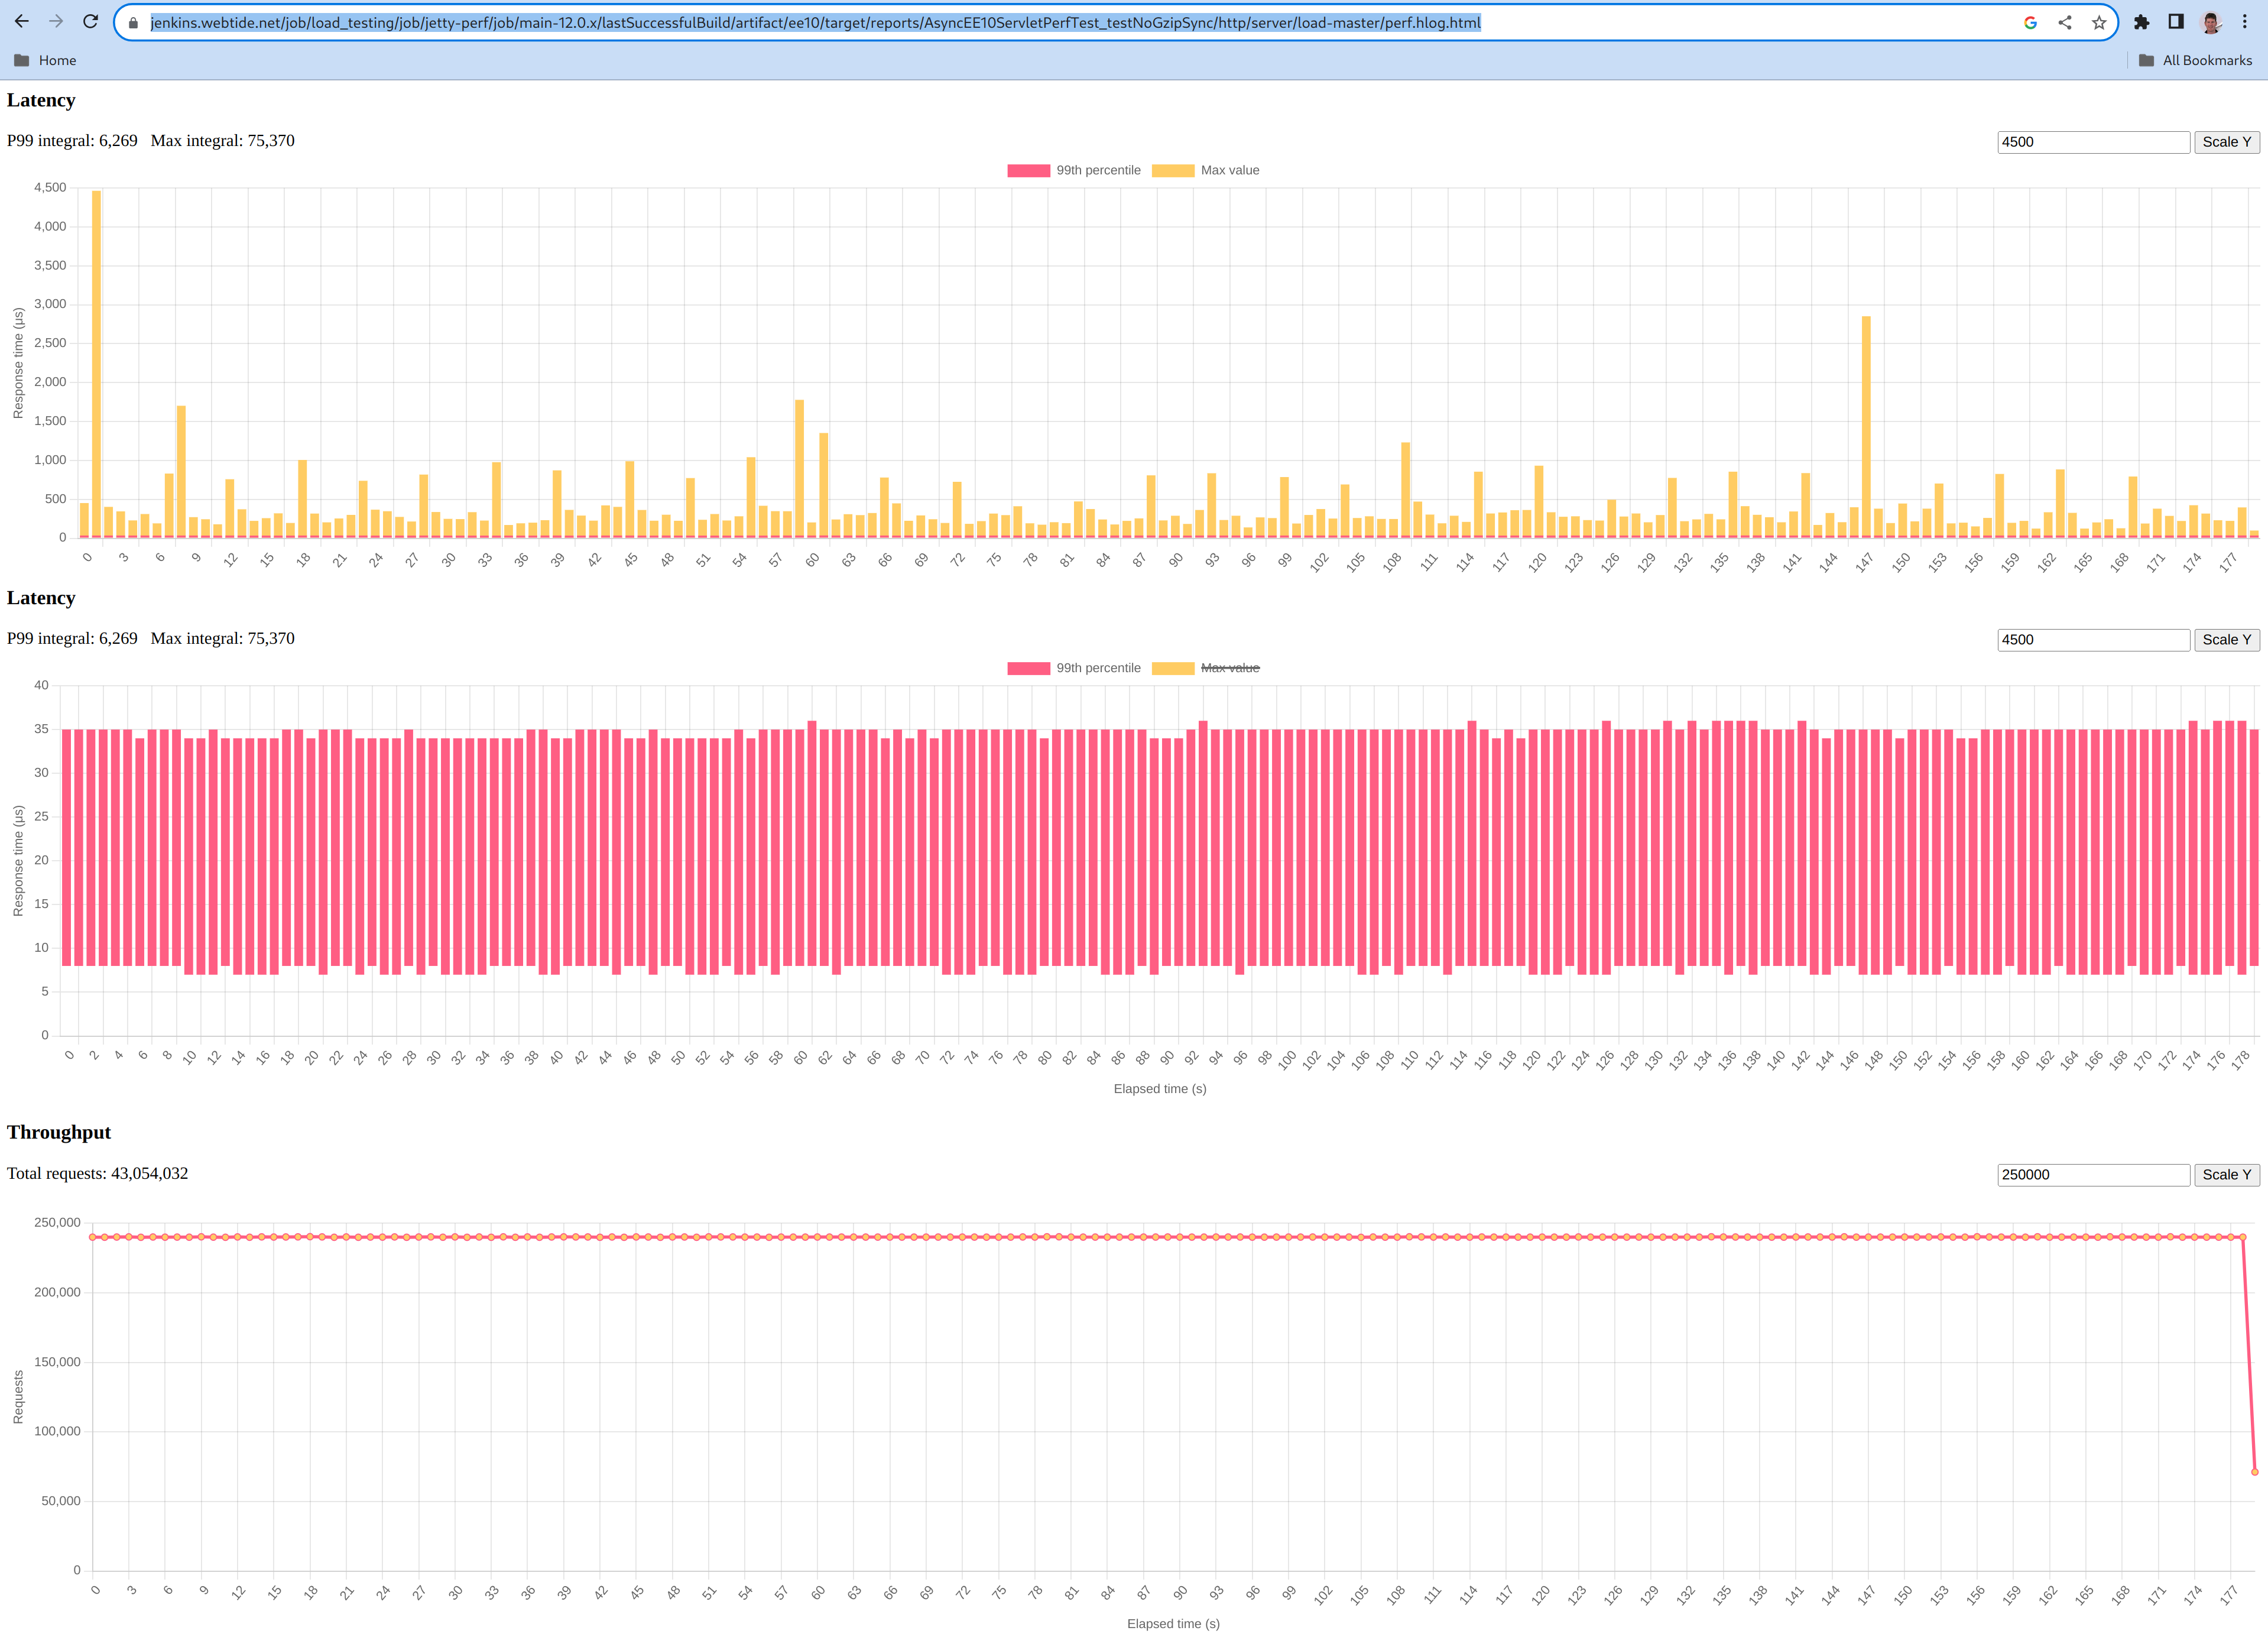
The yellow graph shows a single early peak at 4500 µs, and then most peaks at less than 1000µs and an average sample peak of 434µs.
The red graph shows a minimum processing time of 7 µs, a P99 processing time of 34.8 µs.
core
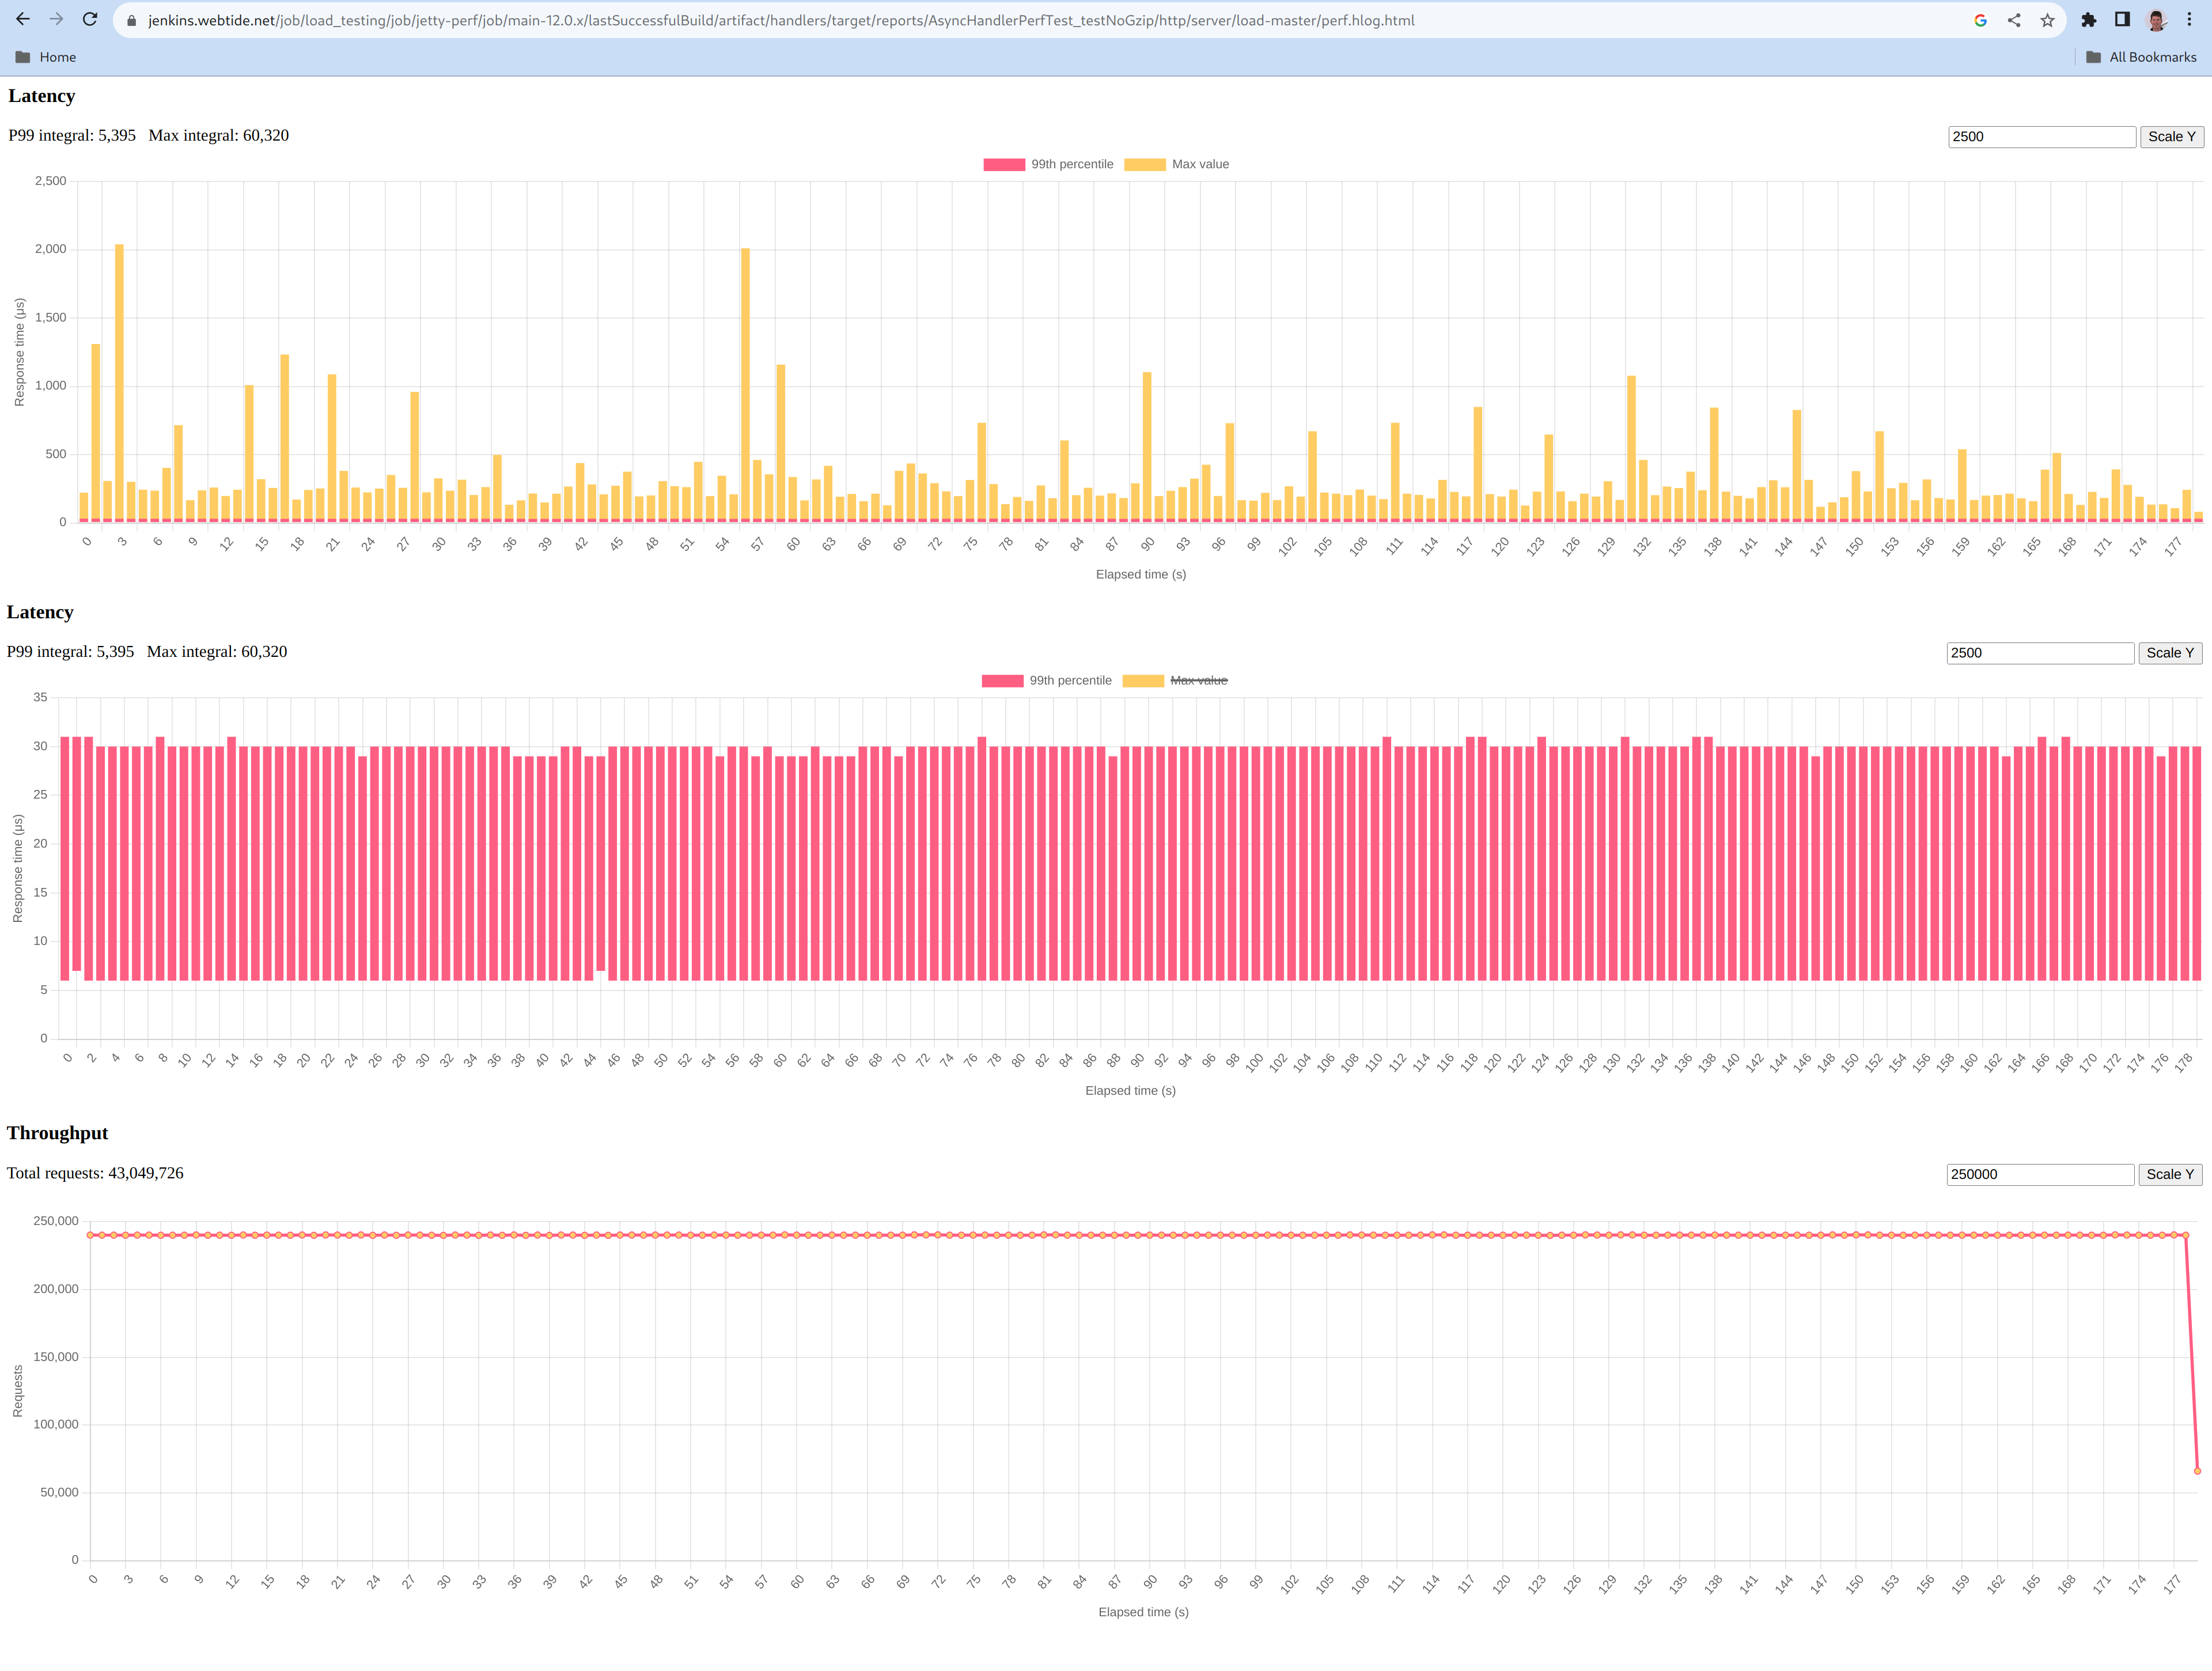
The yellow graph shows a few peaks at a 2000 µs with the average sample peak being 335µs.
The red graph shows a minimum processing time of 6 µs, a P99 processing time of 30.0 µs.
Comparing to Jetty 11
Comparing apples to apples required us to slightly modify our benchmark to:
- Use the exact same servlet on Jetty 11 as well as Jetty 12 ee9 and ee10
- Write a Jetty 12 core handler that is a fair equivalent to the above servlet
- Align the handler chains
- Introduce a more precise latency measurement in Jetty 12
- Backport that API to Jetty 11
- Modify the Jetty 11 and 12 benchmarks to use that new API
In the following benchmark, the CPU consumption of the server machine stayed around 40%, like with Jetty 12.
Below are the same plots of the maximum (graph in yellow), minimum to P99 (graph in red) processing times for Jetty 11:
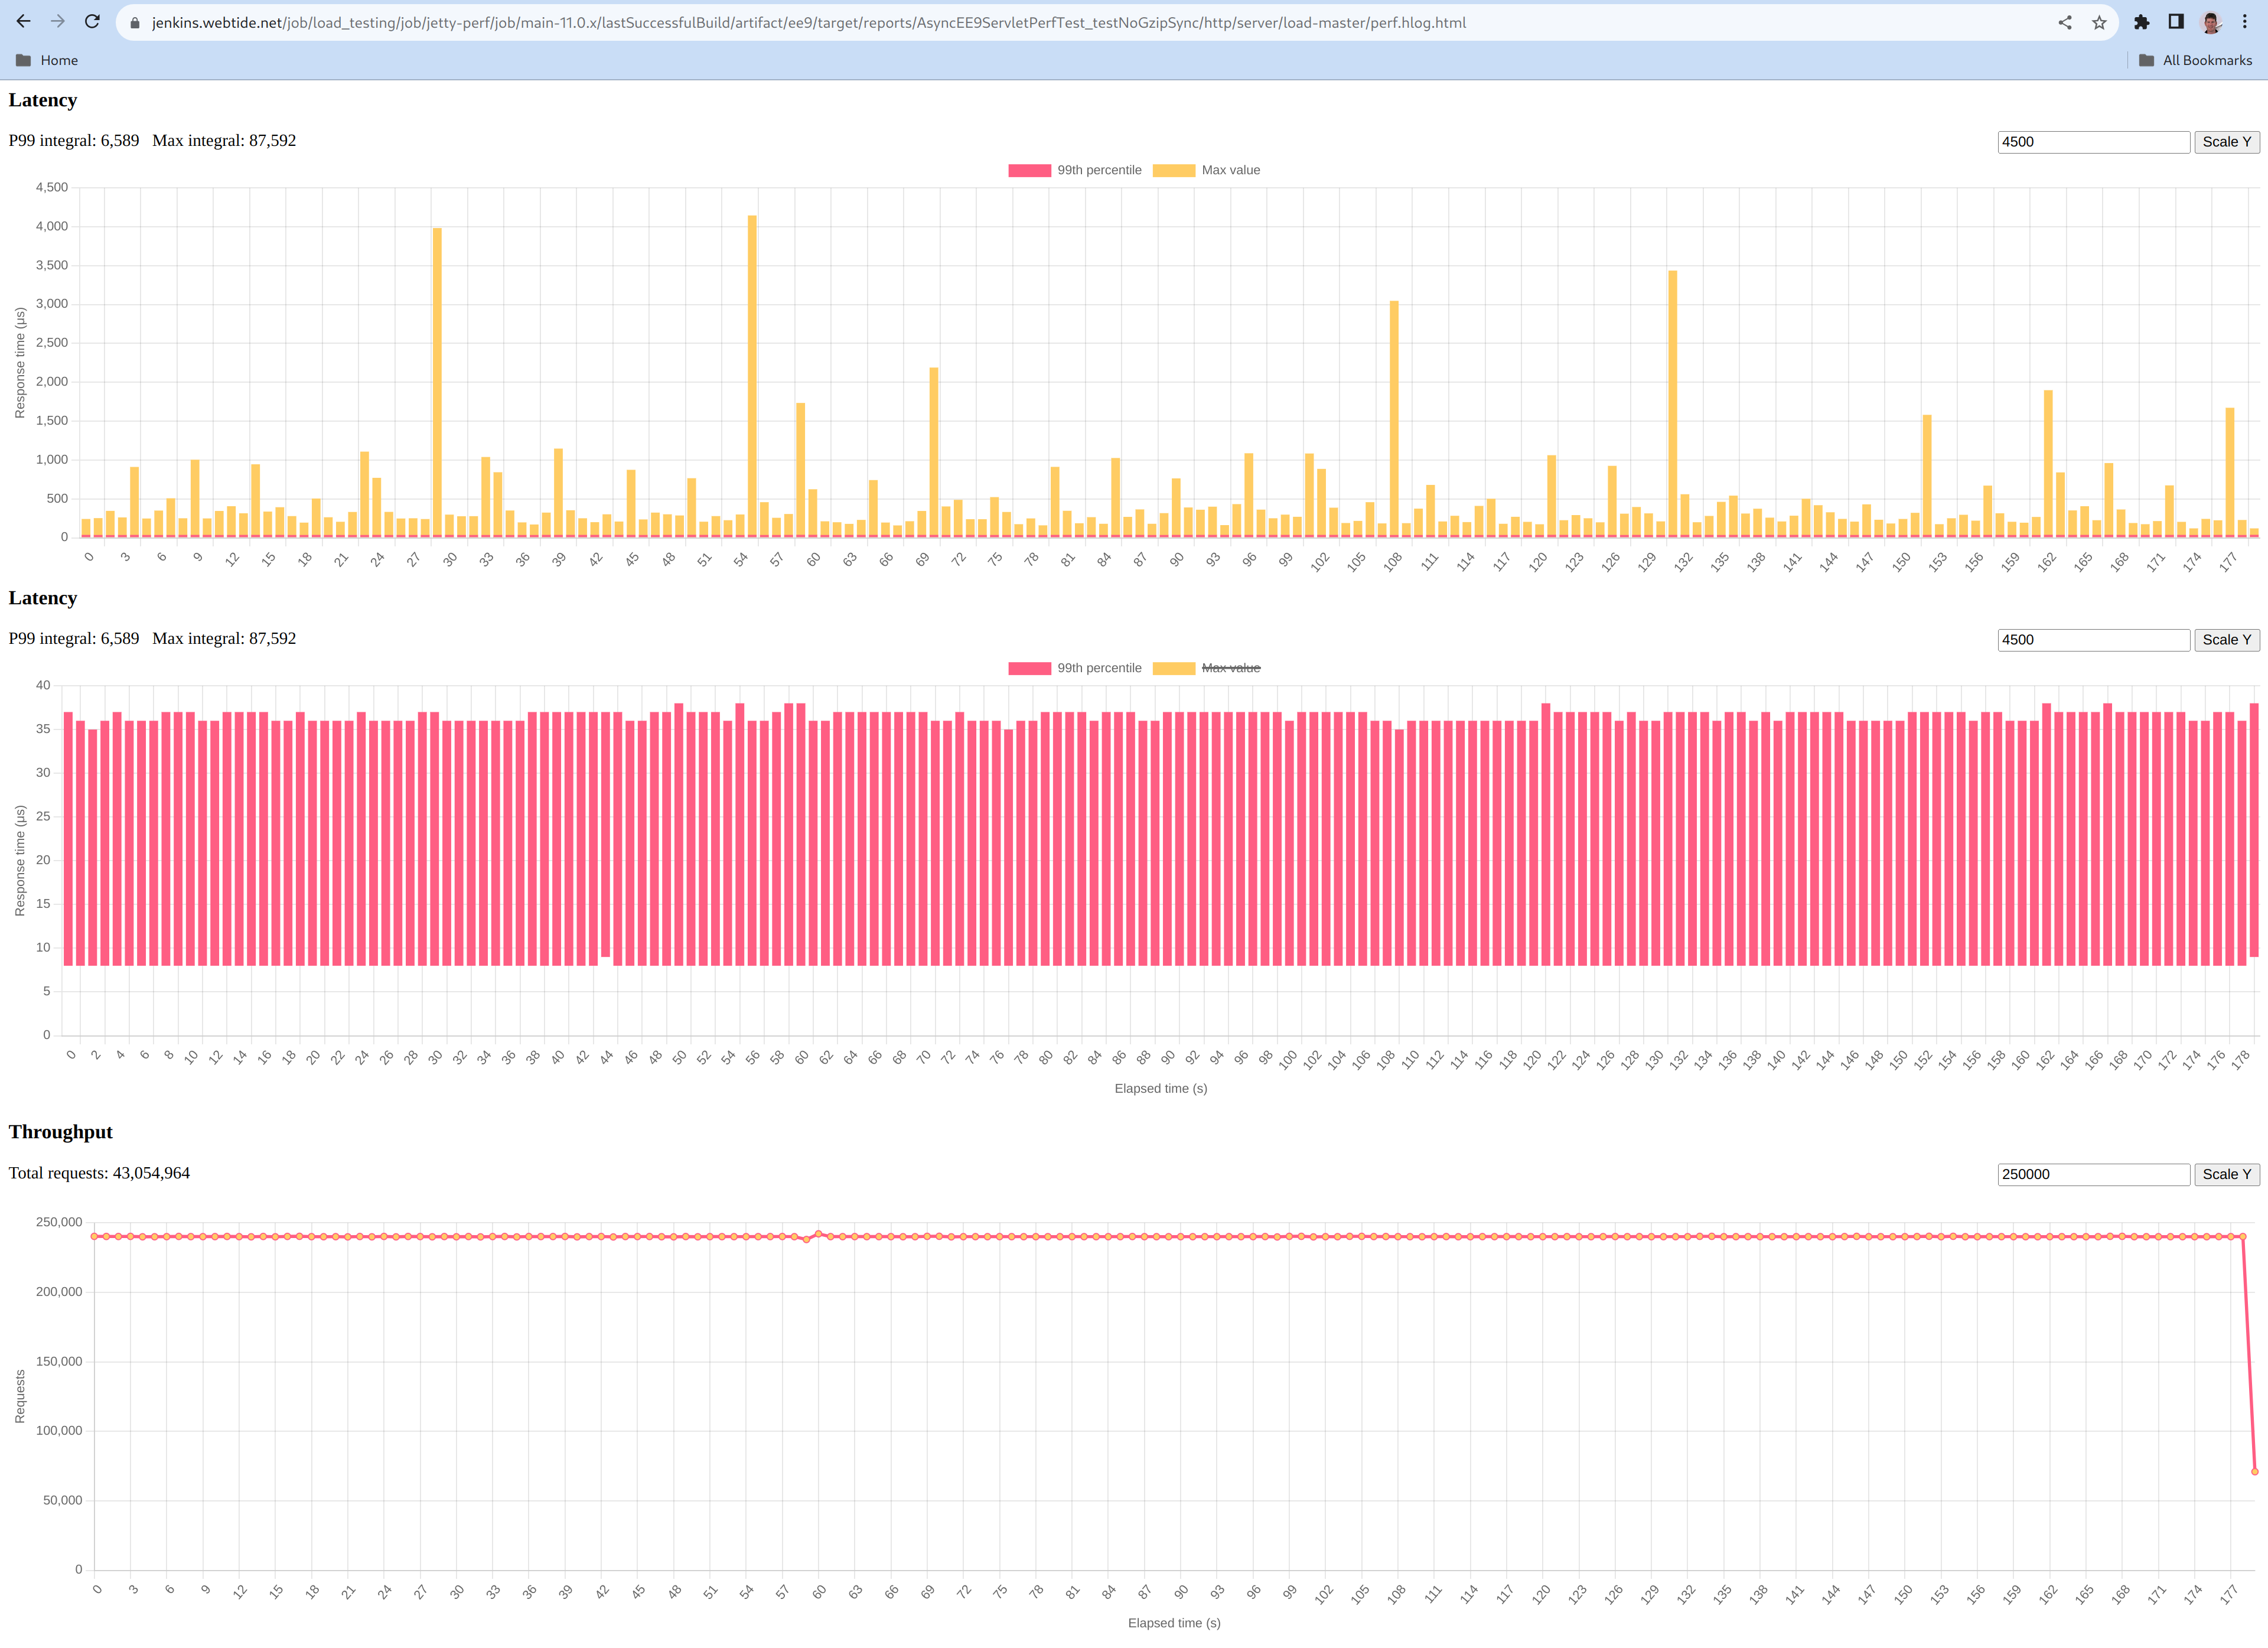
The yellow graph shows a few peaks at a 4000µs with an average sample peak of 487µs.
The red graph shows a minimum processing time of 8 µs, a P99 processing time of 36.6 µs.